Operations and facility managers at warehouses and distribution centers have always kept an eye out for any opportunity to increase productivity and efficiency while reducing costs. Now, as supply chain disruptions, labor and real estate shortages, and fierce competition remain the everyday experience in warehousing, operational improvements matter more than ever—and the impacts of improvements on customer satisfaction and employee experience matter, too.
Thanks to advances in data capture, collection, and analytics, ops managers have access to more warehouse performance data than ever before. It’s easy to access just about any data point you could want to see. But which key performance indicators (KPIs) will tell you the most about whether your warehouse is performing to its full potential? Are they the same KPIs that can help point to specific changes or updates you could make to your facility, like updating your warehouse labeling system or reorganizing your footprint?
While every warehouse is different, a few specific KPIs can be especially helpful in identifying improvement opportunities—and measuring the impact of changes after you implement them.
It should go without saying that warehouse safety KPIs such as accidents per year, time since the last accident, and PPE utilization deserve every manager’s attention; workplace safety makes productivity possible, after all.
But in addition to those metrics, use the following KPIs in your continuous improvement strategies, first by benchmarking and then monitoring, as you implement changes to your warehouse barcode system, layout, workspace organization, and processes. When you combine these KPIs with cost-related metrics, you can develop a clearer picture of opportunities for improving profitability.
Which Warehouse KPIs Tell You What You Need to Know?
If you use a warehouse management system (WMS) with the capability to set up automated data collection and analytics, it’s easy to check in on performance metrics on a regular basis as you implement training programs, deploy new tools and systems, and tweak or overhaul processes.
1. Inventory accuracy
Any warehouse or DC’s overall performance relies on accurate, up-to-the-minute clarity with regard to inventory. Inventory accuracy impacts everything from reordering product to order fulfillment. A clear picture of inventory helps you understand storage costs, carrying costs, and more. It’s hard to overstate the importance of regular cycle counts to see how well your WMS, warehouse barcode system, and scanning devices are working to help employees track inventory.
Regular cycle counts also help fill in the data gaps to understand the effects of shrinkage on your business. Keeping close tabs on inventory shrink shows you which items evaporate from inventory; from there, determining the cause (damage, miscounts, theft, etc.) is a matter of investigation.
2. Receiving efficiency
When you know how much inventory workers are capable of receiving per hour, you can put that data to use in scheduling inbound shipments and employee shifts, benchmarking performance expectations, and even incentivizing productivity. A closer look may reveal surprising ways you can streamline receiving, like introducing mobile warehouse printing to print and issue goods receipts right at the dock door.
3. Receiving and putaway cycle times
Understanding key inventory items’ receiving cycle times (how long it takes to get from receiving to storage) and putaway cycle times (from storage to floor) helps managers anticipate and predict order fulfillment and lead times—particularly useful information when items are in high demand. These cycle times also indicate efficiency: how difficult is it to move the item? To find its correct location? Does it require special handling or equipment? All these details impact receiving cycle times.
4. Putaway productivity
This describes the volume of inventory one worker can put away per hour, and it can also help shed light on the efficiency of your warehouse floor plan. It pays to understand the range of productivity based on various products in your inventory, as well as individual workers’ productivity.
5. Picking accuracy
Returns are expensive—to the tune of billions of dollars each year in the U.S. As ugly and costly as the truth may be, it’s tough to know you’re addressing returns if you don’t monitor them closely. This KPI compares total orders fulfilled with the number of returned incorrect items. Understanding picking accuracy can help you dig deeper into trends, to see where the most common errors occur and make process changes to prevent them.
6. Order cycle time
As with receiving and putaway, total order cycle time can help you understand which areas are the most time-consuming between order and shipment. The order cycle time covers inventory from acceptance of an order to picking, packing, and preparing to ship. Knowing the time it takes through each step, but also the total time, can highlight process bottlenecks between tasks.
7. Order lead time
This KPI follows customer orders all the way to the customer, including time in transit and delivery. It’s important because lead time has a direct impact on customer satisfaction. It can also reveal shipping issues when compared against order cycle time. Long lead times are bad news—especially in ecommerce, when customers can take their business elsewhere with little to no effort on their part.
8. Backorder rate
How many orders are on backorder at any given time? Can you identify seasonal trends and make order adjustments accordingly? Are there common repeat offenders that point to a need for new sourcing? Backorders eat away at customer satisfaction, so an awareness in this area is key.
9. Fulfillment accuracy
How many orders make it through your facility, start to finish, order through fulfillment, with 100% success? Success means they’re fully and correctly picked, all items are in stock, and nothing is on backorder. They’re properly packaged so no items are damaged in transit or handling. They’re correctly dispatched and delivered, on time, all together. Divide your number of perfectly fulfilled orders by the number of total orders to calculate your fulfillment accuracy rate.
10. Return rate
What percentage of your customers return items—whether due to inaccurate picking, damage in transit, shipping mistakes, late delivery, or another reason? By monitoring your warehouse return rate, you could even uncover return fraud or identify product issues or suppliers with quality problems. Calculate return rates by dividing the number of items returned by the total number of items sold.
11. Labor and equipment utilization
A focus on inventory management is primary, but it’s also important to understand the impacts of labor and equipment costs, and your effective utilization of those resources, to improve efficiency and profitability. Underutilized workers are often not only negatively affecting your bottom line; employees who feel underutilized could also be a turnover risk. Costly material handling equipment or data capture devices left unused should nudge a second look at planning, purchasing, and leasing those assets.
12. Space utilization
One square foot of U.S. warehouse space costs about $7.96 a year.1 Most warehouses in the U.S. are more than 25,000 square feet, and more than a third are over 100,000 square feet.2 With demand pushing prices upward, warehouse and DC managers know the importance of achieving optimal space utilization. Understanding your utilization rate of your facility’s total volume can help you solve for the squeeze—that is, if you have room to move upward before you have to look outward.
Warehouse Data Best Practices: What to Do with the Data
Of course, these 12 KPIs aren’t the only numbers that matter; there are literally dozens of metrics you can track. But to avoid paralysis by analysis, it’s really vital to select and monitor the KPIs that have the greatest impact on your facility’s overall performance and profitability. The point is to use data to create a clear picture of each area, each cycle, key inventory items, and the most informative data targets for you.
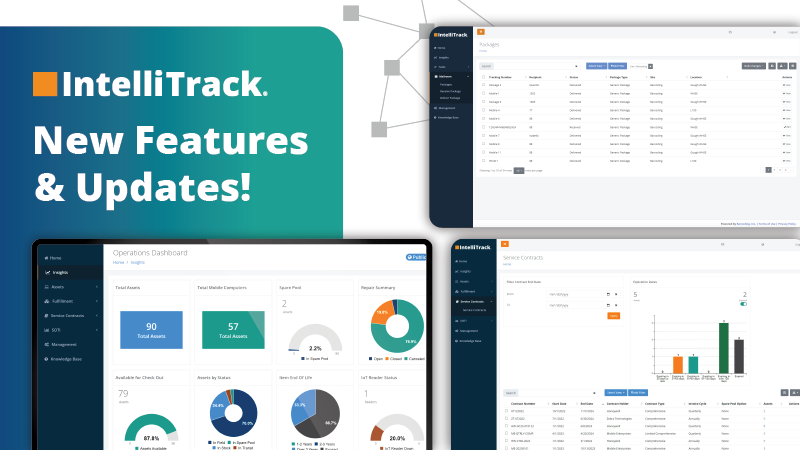
Once you identify your information needs and choose your data targets, your inventory management system should enable you to configure a data dashboard that automates collection, analysis, and updating of your metrics. Determine regular intervals for monitoring, review often, and make adjustments as you refine your data approach.
The information you get can help you plan and adjust to increasing demands, justify investments in equipment and resources, and prevent undue employee turnover as your business grows. Learn more about how to handle warehouse growth with our free guide. Just click the link below to download a copy today.


